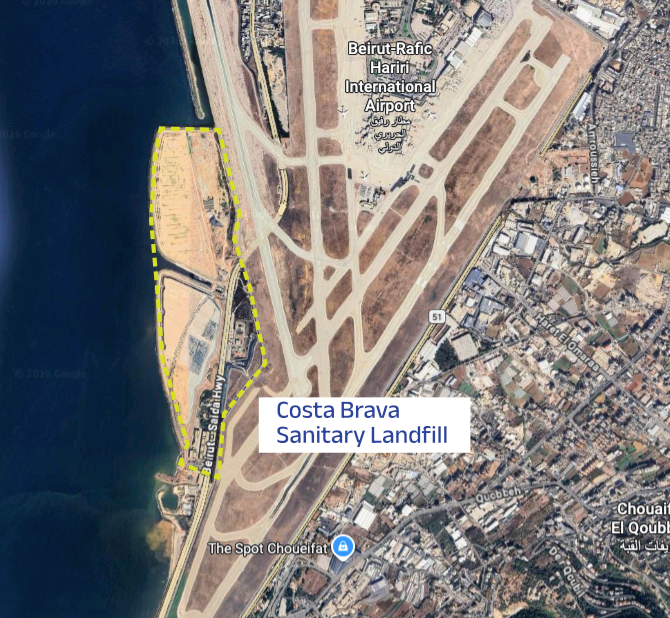
Costa Brava Sanitary Landfill
33°48'49.7"N 35°28'49.6"E
Operating beyond capacity
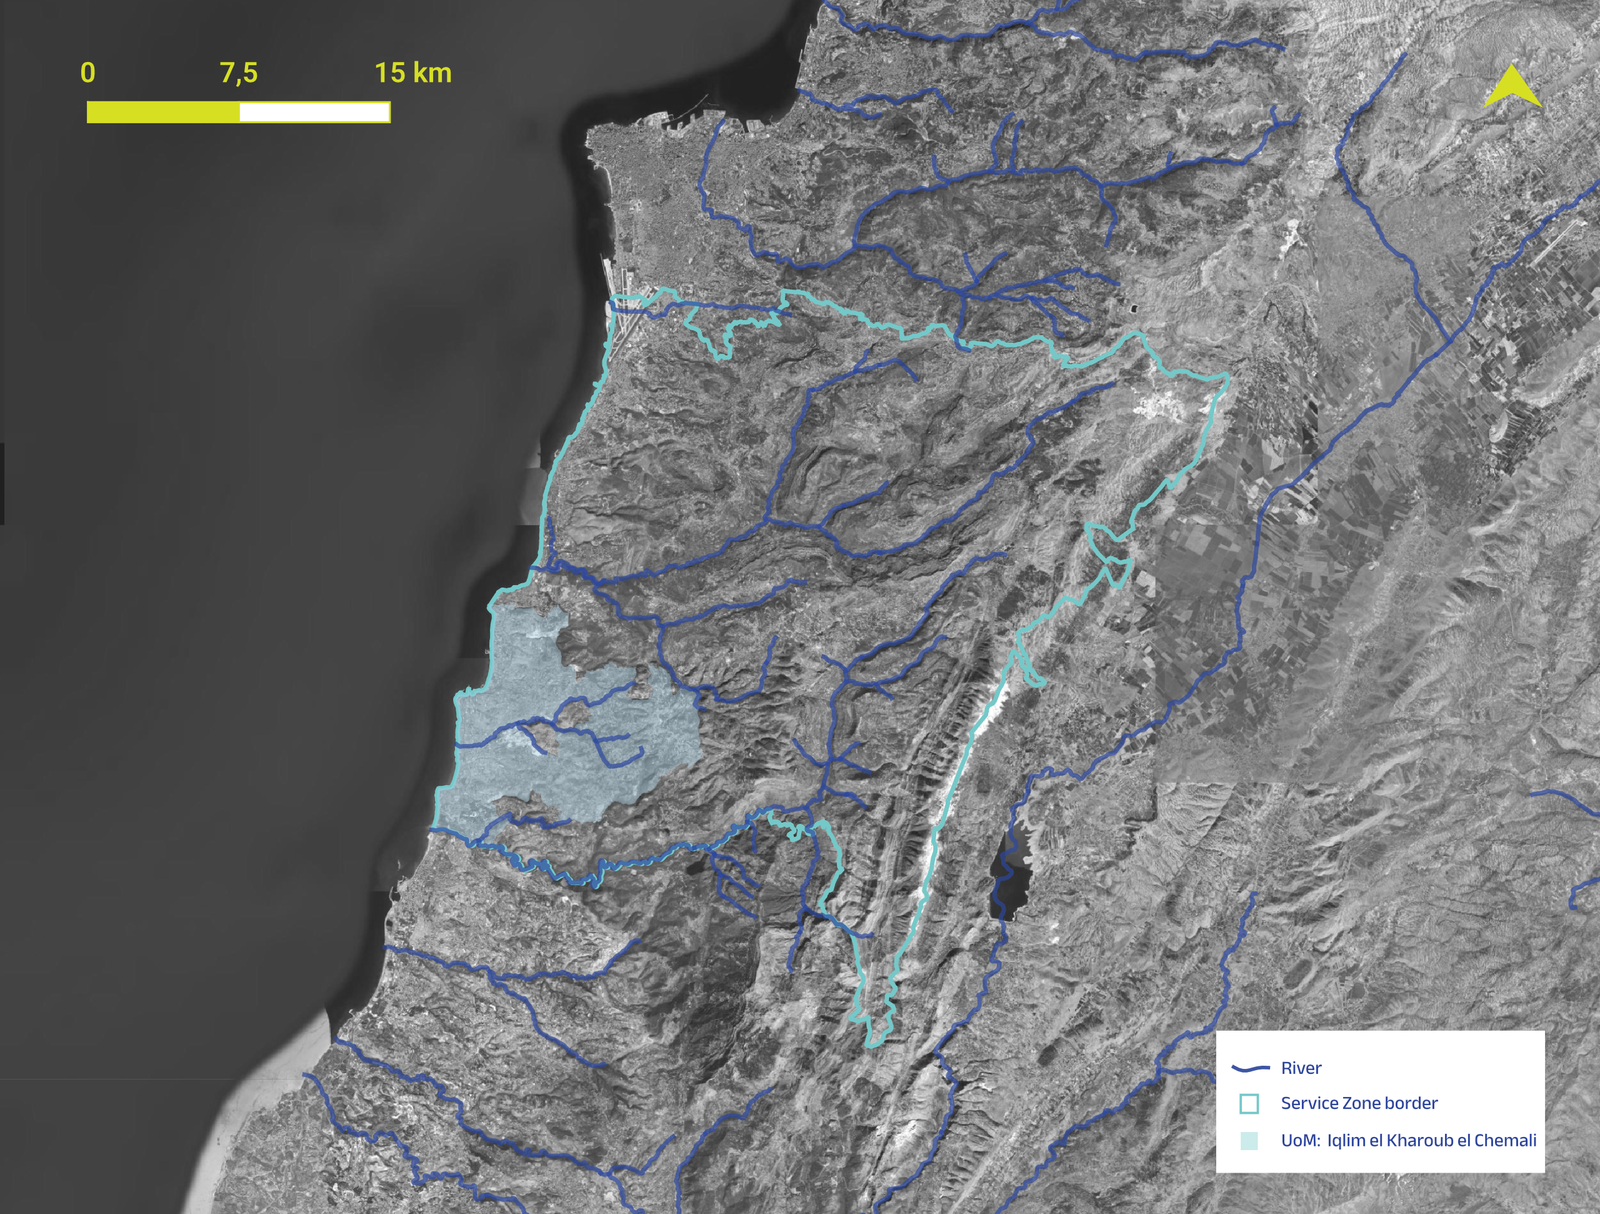
Service Zone 8, covering the Aley and Chouf districts, operates a relatively centralized waste management system where municipalities retain formal responsibility but rely mainly on private contractors for service delivery. City Blu is the primary operator, managing collection, transport, and disposal across most municipalities. Waste from Aley is mainly directed to Costa Brava Landfill, while Chouf is partially served by the Baadaran and Soueijani mechanical biological treatment facilities, with residues also sent to Costa Brava. Collection coverage is estimated at nearly 100 percent, supported by a widespread network of communal bins and regular secondary collection services.
Despite this high coverage, waste is predominantly collected as mixed waste, with limited source separation at household level. Formal material recovery remains low, and recycling activities are largely driven by the informal sector. Some municipalities continue to use aging or poorly maintained vehicles, and uncovered trucks can cause minor leakages during transport.
The Costa Brava landfill remains operational but is widely considered to have reached or exceeded its capacity. In response to growing waste pressures and post-conflict rubble from southern Beirut, the government approved plans in 2025 to expand the site using demolition debris. However, the landfill continues to face significant environmental and public concerns due to its coastal location, pollution risks, and long-standing role as an overburdened emergency waste disposal facility.
*Due to challenges in accessing data, a proxy value of 30% was applied to account for waste generated by non-household sources, including markets, commercial establishments, private and public sector facilities, educational institutions, hospitals, and hotels.
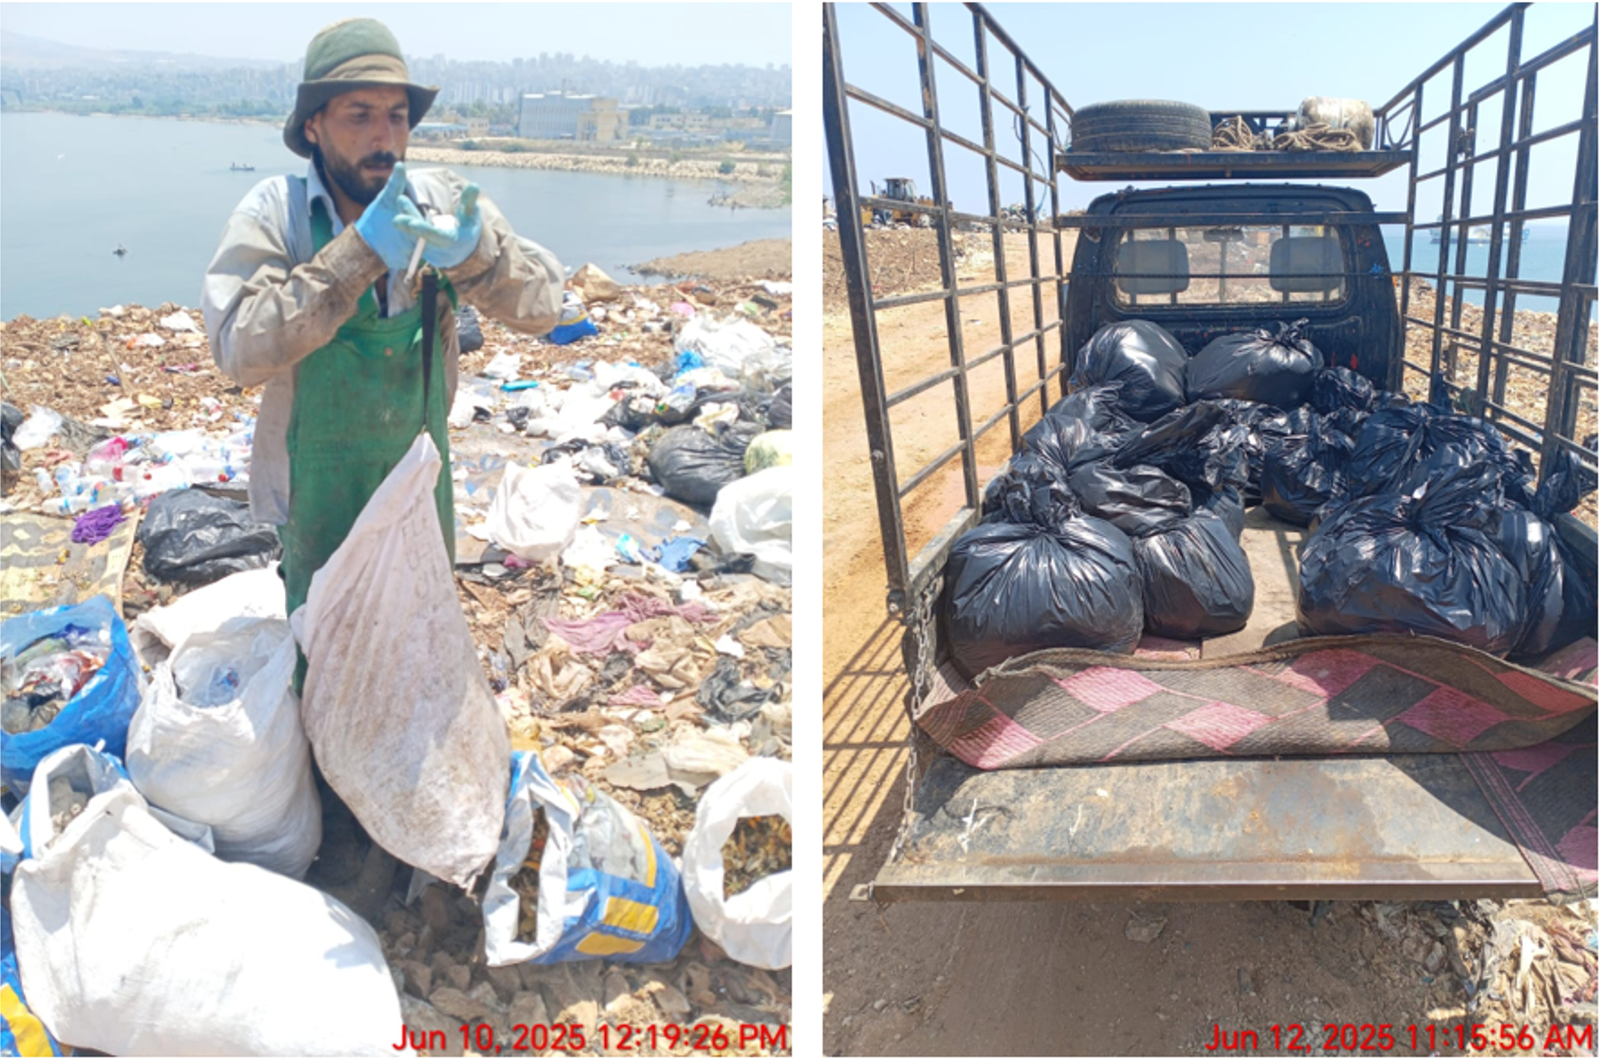
During June, July and August 2025, our partner Libanconsult AGM carried out a detailed waste assessment together with UN-Habitat Lebanon. Before starting the fieldwork, the team met with local authorities and community stakeholders to explain the process, align expectations, and ensure smooth coordination. Local staff also received hands-on training to support the data collection.
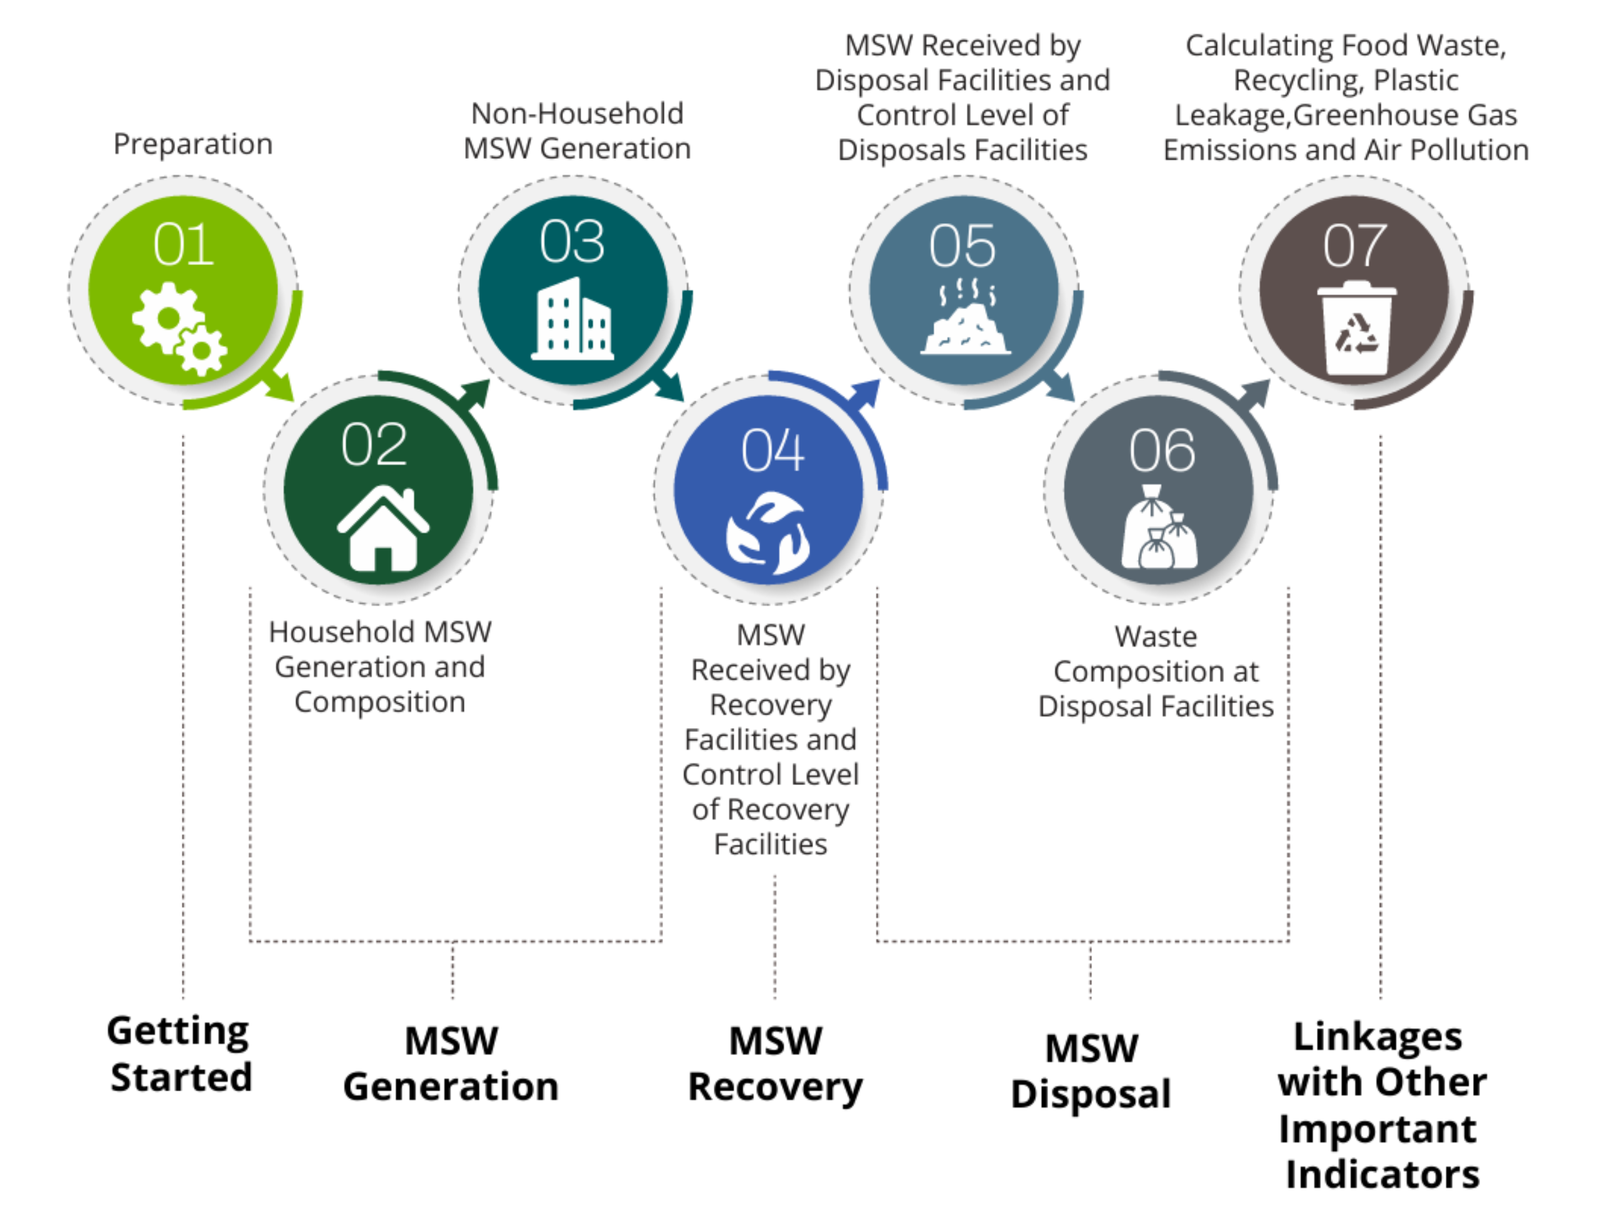
This assessment used three internationally recognised tools that help cities understand how much waste they generate, how it is handled, and where problems—such as plastic leakage—may occur. Together, these tools give a clear and up-to-date picture of the municipal solid waste system.
WaCT is a step-by-step method that helps cities measure how much of their municipal waste is safely collected and managed. It supports global Sustainable Development Goal (SDG) 11.6.1 and provides insights on food waste and resource recovery. Using WaCT, the team measured waste quantities, composition, and how waste moves through the system—from households to final disposal or recycling.
A sample of 33 households was selected across three representative sampling zones within SZ2. The selection process was guided by WaCT and refined through a socio-economic analysis conducted in coordination with local authorities.
The WFD maps what happens to waste after it is generated, with a special focus on plastics. It shows how waste flows through the system, where materials are recovered or reused, and where leakage into the environment occurs. This helps identify hotspots that require action.
WABIs offer a standardized way to evaluate how well the waste system is performing. The indicators cover both the physical aspects (collection, treatment, recycling) and the governance aspects (financial sustainability, inclusion of informal workers, and policy frameworks). These indicators help compare performance across areas and highlight key strengths and gaps.